If the traditional Synergy runtime encounters a serious error (such as a segmentation violation), it may crash or hang. In cases like this, it may be possible to capture a dump file to analyze what went wrong. In general, these dump files don’t contain a lot of information that would be useful to a general user, so it would be best to let the Synergex Development team analyze them.
However, it is possible to find the name of the current routine that was running when the dump file was captured (as well as the call stack of routines leading to the current one). This information may help an application programmer determine where the problem occurred as well as help to debug the dbl code.
The name of the current routine in stored in the variable: g_fptr->mptr->owner->se_name
If you add “prev” between “g_fptr” and “mptr,” you can get the name of the routine that called the current routine, and so on until you get a complete call stack, e.g.,
g_fptr->prev->mptr->owner->se_name
g_fptr->prev->prev->mptr->owner->se_name
etc.
You can find this value by analyzing the dump file using a program like Visual Studio or windbg. Instructions for both programs follow. Note that the instructions assume that the failing program was running in the dbr runtime. If it was running in a different runtime, like dbs or dbssvc, replace the name as appropriate.
Also note that these instructions only work for a full dump file (a dump file that includes the heap). A minidump file without the heap won’t have the information we want.
Visual Studio
- Select File > Open > File… and select the dump file to open.
- Under Actions, select Debug with Native Only.
- Check the call stack (select Debug > Windows > Call Stack if the window isn’t open already). If there isn’t one pointing to a call in dbr, double click on a call that is in dbr.
- If you’re analyzing the dump file on the same system where it was created, or on a system with the same version of Synergy, Visual Studio should automatically load the dbr.pdb file and be able to access the symbols. But if you’re analyzing the file on a system with a different version of Synergy or Synergy is not installed at all, you’ll probably see a message that says “dbr.pdb not loaded.” In that case,
- Copy dbr.pdb over to the system running Visual Studio. Make sure the version and bit-size of the .pdb file exactly match those of the dbr.exe used to create the dump file, or else the symbols won’t work.
- If you placed the .pdb file in a different location than the dump file, click the “New Path” button and type the path to the .pdb file.
- Click the Load button. Visual Studio should look in the location you specified (or the location of the dump file) and load the symbols.
- If a window pops up and asks for the location of a .c source file, cancel out of it.
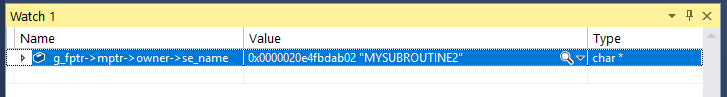
- Open a Watch window if it isn’t open already (select Debug > Windows > Watch > Watch 1).
- Under the Name column, type “g_fptr->mptr->owner->se_name”. The Value field should populate with the name of the routine that was running when the dump file was generated:
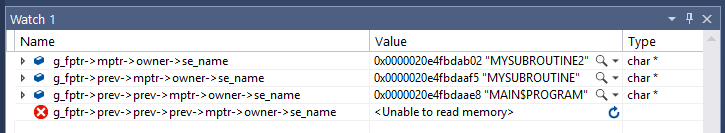
- If desired, repeat the previous step, adding “prev” between “g_fptr” and “mptr”. Repeat this until you get a full dbl call stack:
- Note that the QuickWatch and Memory windows can also be used to examine variables.
windbg
- Select File > Open Crash Dump… and select the dump file to open.
- Enter the command
.sympath+ path_to_dbr.pdb
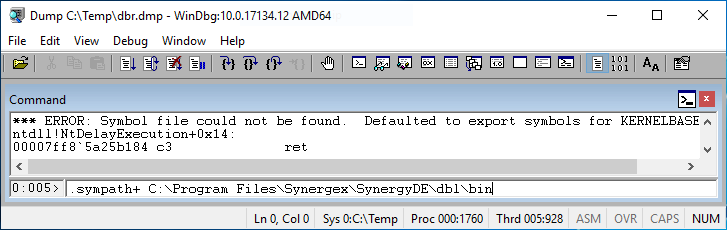
This will tell the debugger where to find the appropriate dbr.pdb file with the symbols needed to interpret the dump file. If you\'re analyzing the dump file on the same system where it was created, specify the install path to the appropriate runtime. If you\'re analyzing the dump file on a system with another version of Synergy (or no Synergy at all) copy over the appropriate .pdb file and specify its location. The version and bit-size of the .pdb file need to match those of the .exe exactly or the symbols won\'t work.
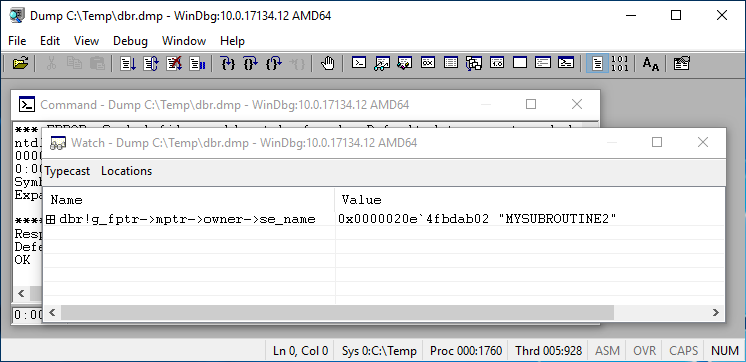
- Select View > Watch to open the Watch window.
- Click under the Name column and type
dbr!g_fptr->mptr->owner->se_name
The “dbr!” part of the name tells the debugger which module we want and helps it locate the correct symbols. The name of the routine should be in the Value column:
- If desired, repeat the previous step, adding “prev” between “g_fptr” and “mptr”. Repeat this until you get a full dbl call stack:
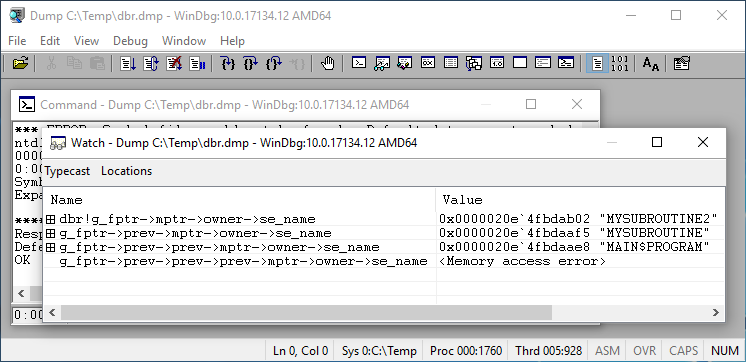
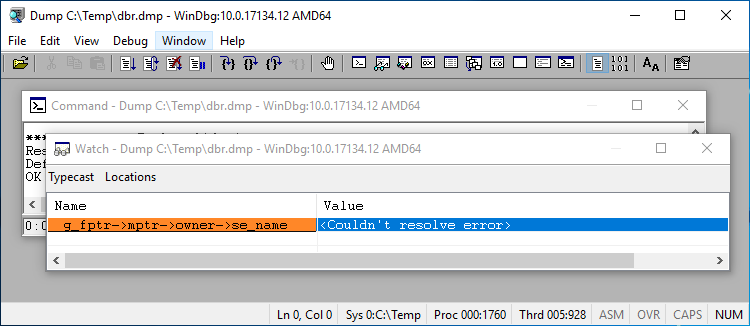
Note that the “dbr!” prefix is no longer necessary, now that the debugger knows where to look for the symbols. But if you had started out without specifying “dbr!”, you might have gotten a “<Couldn’t resolve error>” message.
THE INFORMATION PROVIDED TO YOU IN THIS SERVICE IS FOR YOUR USE ONLY. THE INFORMATION MAY HAVE BEEN DEVELOPED INTERNALLY BY SYNERGEX OR BY EXTERNAL SOURCES. SYNERGEX MAKES NO WARRANTIES, EXPRESS OR IMPLIED, REGARDING THIS INFORMATION, INCLUDING THE WARRANTIES OF MERCHANTABILITY OR FITNESS FOR A PARTICULAR PURPOSE. IN NO EVENT SHALL SYNERGEX BE LIABLE FOR ANY DAMAGES OR LOSSES INCURRED BY YOU IN USING OR RELYING ON THIS INFORMATION, INCLUDING WITHOUT LIMITATION GENERAL DAMAGES, DIRECT, INCIDENTAL, SPECIAL OR CONSEQUENTIAL DAMAGES, OR LOSS OF PROFITS, EVEN IF SYNERGEX HAS BEEN ADVISED OF THE POSSIBILITY OF SUCH DAMAGES.
 800.366.3472
 Get Support
 Documentation
